
Day 11 of NTRESS 6000
Written on October 1, 2024
today we were working on data import, export, and conversion between data types!
first things first, we need to load tidyverse
library(tidyverse)

coronavirus <- read_csv('https://raw.githubusercontent.com/RamiKrispin/coronavirus/master/csv/coronavirus.csv')
we have been working with this coronavirus dataset from here
coronavirus |>
  filter(cases > 0) |>
  group_by(date,type) |>
  summarise(cases=sum(cases)) |>
  ggplot() +
  geom_col(aes(date,cases,fill =type))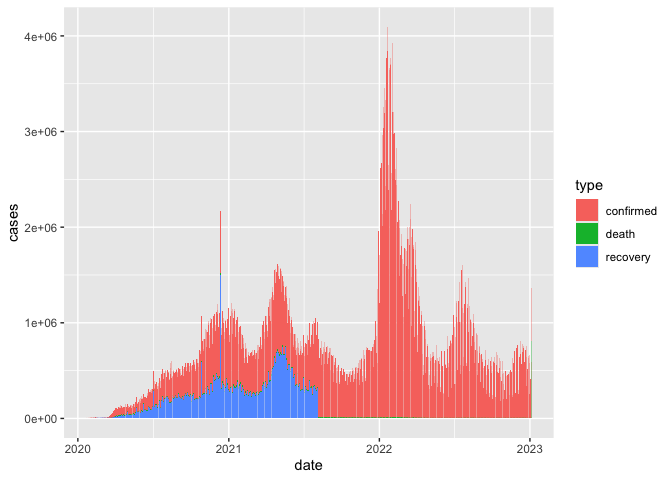
this is what our data looks like
## # A tibble: 6 × 15
##   date       province country   lat  long type     cases   uid iso2  iso3  code3
##   <date>     <chr>    <chr>   <dbl> <dbl> <chr>    <dbl> <dbl> <chr> <chr> <dbl>
## 1 2020-01-22 Alberta  Canada   53.9 -117. confirm…     0 12401 CA    CAN     124
## 2 2020-01-23 Alberta  Canada   53.9 -117. confirm…     0 12401 CA    CAN     124
## 3 2020-01-24 Alberta  Canada   53.9 -117. confirm…     0 12401 CA    CAN     124
## 4 2020-01-25 Alberta  Canada   53.9 -117. confirm…     0 12401 CA    CAN     124
## 5 2020-01-26 Alberta  Canada   53.9 -117. confirm…     0 12401 CA    CAN     124
## 6 2020-01-27 Alberta  Canada   53.9 -117. confirm…     0 12401 CA    CAN     124
## # ℹ 4 more variables: combined_key <chr>, population <dbl>,
## #   continent_name <chr>, continent_code <chr>
**lets filter this raw dataset to keep only the
date,
country,province,type,and
cases
we then are piping that dataframe into filter to
only keep cases on january 3rd, 2021
## # A tibble: 852 × 5
##    date       country        province                         type      cases
##    <date>     <chr>          <chr>                            <chr>     <dbl>
##  1 2021-01-03 Canada         Alberta                          confirmed  3800
##  2 2021-01-03 United Kingdom Anguilla                         confirmed     2
##  3 2021-01-03 China          Anhui                            confirmed     0
##  4 2021-01-03 Netherlands    Aruba                            confirmed    32
##  5 2021-01-03 Australia      Australian Capital Territory     confirmed     0
##  6 2021-01-03 China          Beijing                          confirmed     2
##  7 2021-01-03 United Kingdom Bermuda                          confirmed     0
##  8 2021-01-03 Netherlands    Bonaire, Sint Eustatius and Saba confirmed     0
##  9 2021-01-03 Canada         British Columbia                 confirmed     0
## 10 2021-01-03 United Kingdom British Virgin Islands           confirmed     0
## # ℹ 842 more rows
okay i got too lazy with marking up this file so deal with some dirty code below!!
library(googlesheets4) #install.packages("googlesheets4")

gs4_deauth()
lotr_gs <- read_sheet("https://docs.google.com/spreadsheets/d/1X98JobRtA3JGBFacs_JSjiX-4DPQ0vZYtNl_ozqF6IE/edit#gid=754443596")
#will help turn whatever you have into a number - helpful if your data isnt read as numeric
parse_double("1,23", locale = locale(decimal_mark = ","))## [1] 1.23## # A tibble: 6 × 5
## student_id full_name favourite.food mealPlan AGE
## <dbl> <chr> <chr> <chr> <chr>
## 1 1 Sunil Huffmann Strawberry yoghurt Lunch only 4
## 2 2 Barclay Lynn French fries Lunch only 5
## 3 3 Jayendra Lyne <NA> Breakfast and lunch 7
## 4 4 Leon Rossini Anchovies Lunch only <NA>
## 5 5 Chidiegwu Dunkel Pizza Breakfast and lunch five
## 6 6 Güvenç Attila Ice cream Lunch only 6library(janitor) #install.packages("janitor")
students |>
clean_names(case="lower_upper") |>
mutate(
age = parse_number(ifelse(age == "five", 5, age)))## # A tibble: 6 × 5
## studentID fullNAME favouriteFOOD mealPLAN age
## <dbl> <chr> <chr> <chr> <dbl>
## 1 1 Sunil Huffmann Strawberry yoghurt Lunch only 4
## 2 2 Barclay Lynn French fries Lunch only 5
## 3 3 Jayendra Lyne <NA> Breakfast and lunch 7
## 4 4 Leon Rossini Anchovies Lunch only NA
## 5 5 Chidiegwu Dunkel Pizza Breakfast and lunch 5
## 6 6 Güvenç Attila Ice cream Lunch only 6